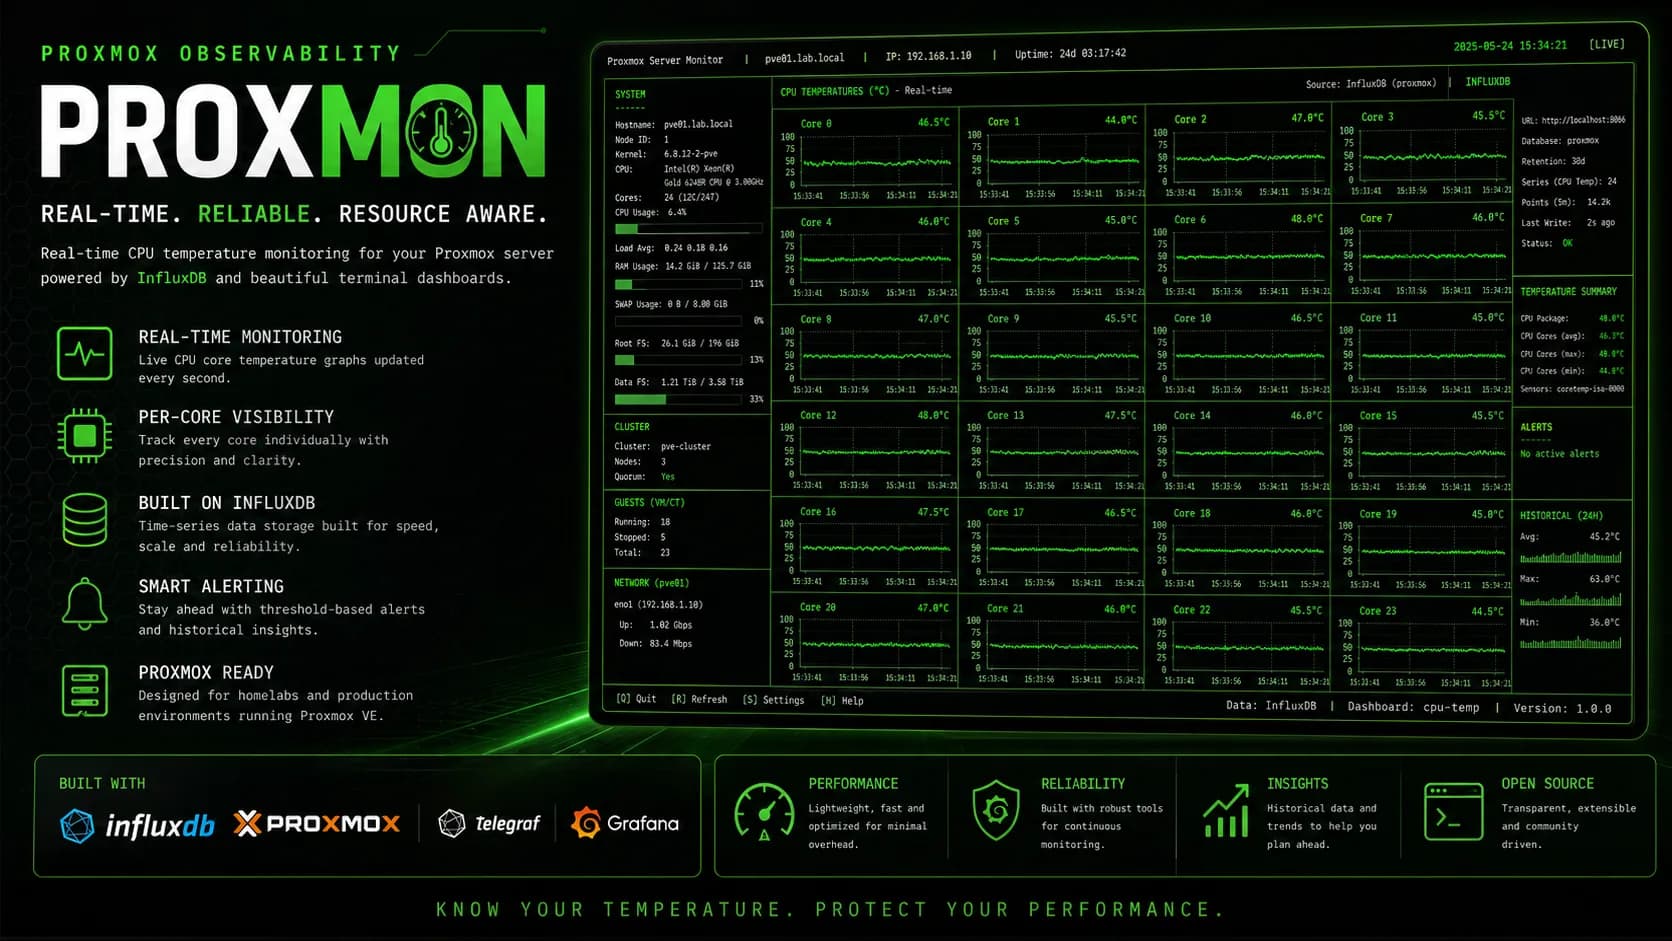
Check and monitor Proxmox CPU temperature with a shell-based collector that sends host sensor metrics to InfluxDB for dashboards and alerts.

You notice the fans ramping on a Proxmox box, open the web UI, and get the usual helpful answer: almost nothing about actual CPU temperature. Great. Very enterprise. Very "go SSH into the host like it is 2009."
This project is a small shell-based Proxmox CPU temperature monitor. It reads CPU sensor data on the host, formats the readings as metrics, and sends them to InfluxDB so the numbers can be graphed, compared, and alerted on instead of trapped in a one-off terminal session.
Proxmox VE is excellent at managing VMs and containers, but hardware temperature visibility depends on the host, sensors, and whatever monitoring stack you bolt on. If you want to answer "what is my Proxmox CPU temperature right now?" or "did the server get hotter after I moved that workload?", you need a repeatable collector.
This monitor keeps the boring part boring:
| Need | What the monitor does |
|---|---|
| Check CPU temperature on a Proxmox host | Reads sensor output from the host OS |
| Track temperature over time | Sends timestamped metrics to InfluxDB |
| Build a dashboard | Produces series that can be visualized in Grafana or another InfluxDB client |
| Catch cooling or workload issues | Makes temperature changes visible enough to alert on |
The script runs on the Proxmox host, reads CPU temperature values from Linux sensor tooling, and writes them into InfluxDB. The intended setup is deliberately simple: shell script, host cron or service runner, and an InfluxDB bucket/database.
Typical flow:
lm-sensors on the Proxmox host.Install sensor support on the Proxmox host:
apt update
apt install lm-sensors
sensors-detect
sensors
Run the monitor with your InfluxDB configuration:
export INFLUX_URL="http://influxdb.local:8086"
export INFLUX_TOKEN="your-token"
export INFLUX_ORG="homelab"
export INFLUX_BUCKET="proxmox"
./proxmox-cpu-temp-monitor.sh
For unattended monitoring, schedule the collector every minute:
* * * * * /opt/proxmox-cpu-temp-monitor/proxmox-cpu-temp-monitor.sh >> /var/log/proxmox-cpu-temp-monitor.log 2>&1
A truthful monitoring page needs actual output, not a heroic stock image of a server looking moody. The collector produces temperature metrics that can be stored and graphed over time:
proxmox_cpu_temperature,host=pve-node-01,chip=k10temp,core=tctl value=52.8
proxmox_cpu_temperature,host=pve-node-01,chip=k10temp,core=ccd1 value=48.5
proxmox_cpu_temperature,host=pve-node-01,chip=coretemp,core=package_id_0 value=55.0
That gives you a clean time series for questions like:
The most useful dashboard is not fancy. It just needs to make the bad number obvious before it becomes a worse number.
| Panel | Why it matters |
|---|---|
| Current CPU package temperature | Quick health check for the node |
| Per-core or per-chip temperature | Spots uneven sensor or cooling behavior |
| 24-hour max temperature | Catches spikes you missed live |
| Temperature vs CPU load | Separates workload heat from cooling problems |
| Alert threshold | Warns before thermal throttling or shutdown risk |
This belongs next to the other tiny infrastructure tools I use to remove recurring papercuts. Portscope catches Docker port conflicts before containers launch. PZEM ESPHome Integration tracks electrical data in Home Assistant. This one handles the thermal side of a Proxmox homelab.
Different dashboards. Same principle: make invisible machine state visible before it bites you.
Use this if:
Do not use it if you need a full observability stack with service discovery, distributed tracing, and a dashboard that requires three meetings to interpret. That is a different genre of suffering.
The project is open source on GitHub. The page canonical is https://bnap.dev/projects/proxmox-cpu-temp-monitor.